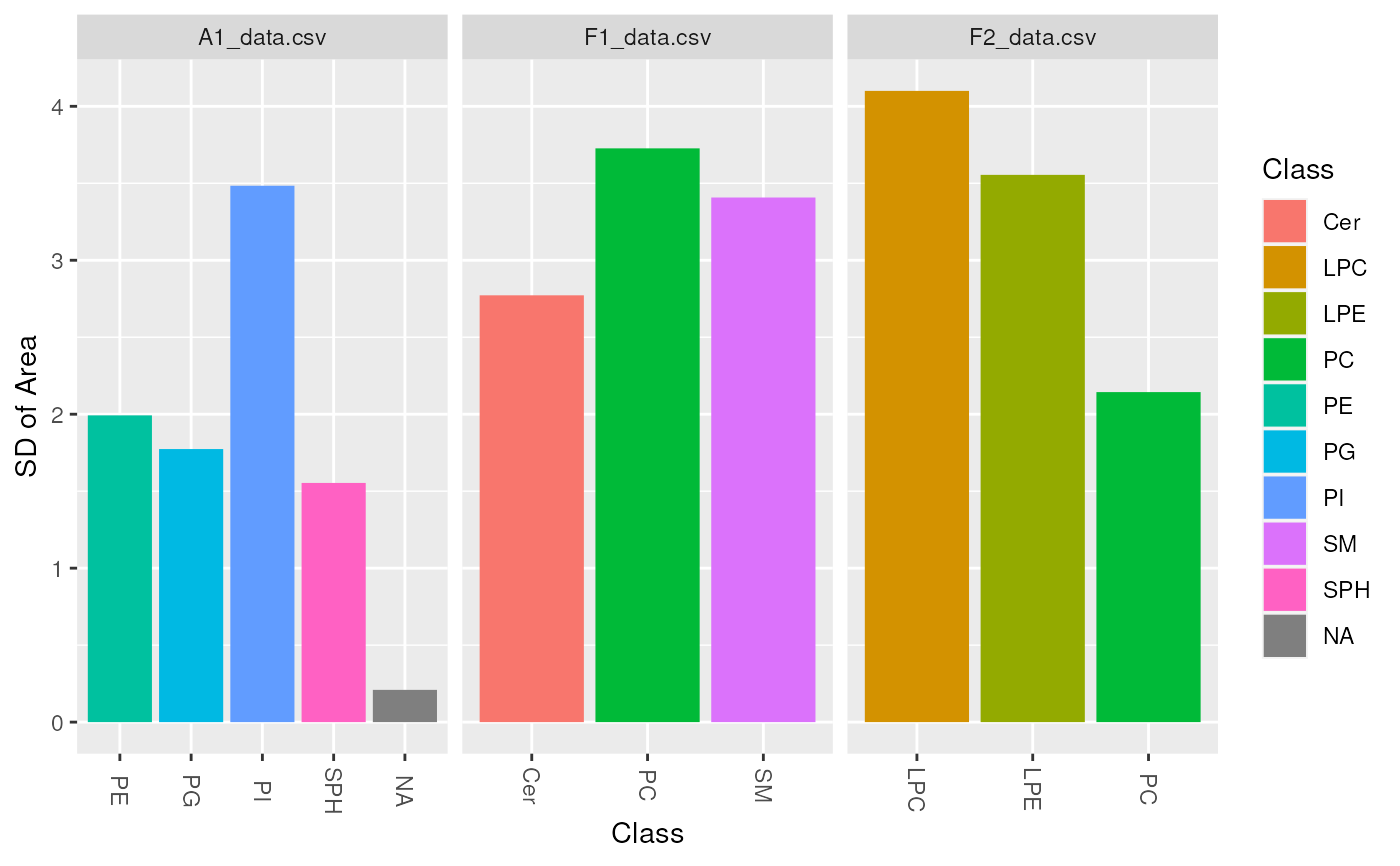
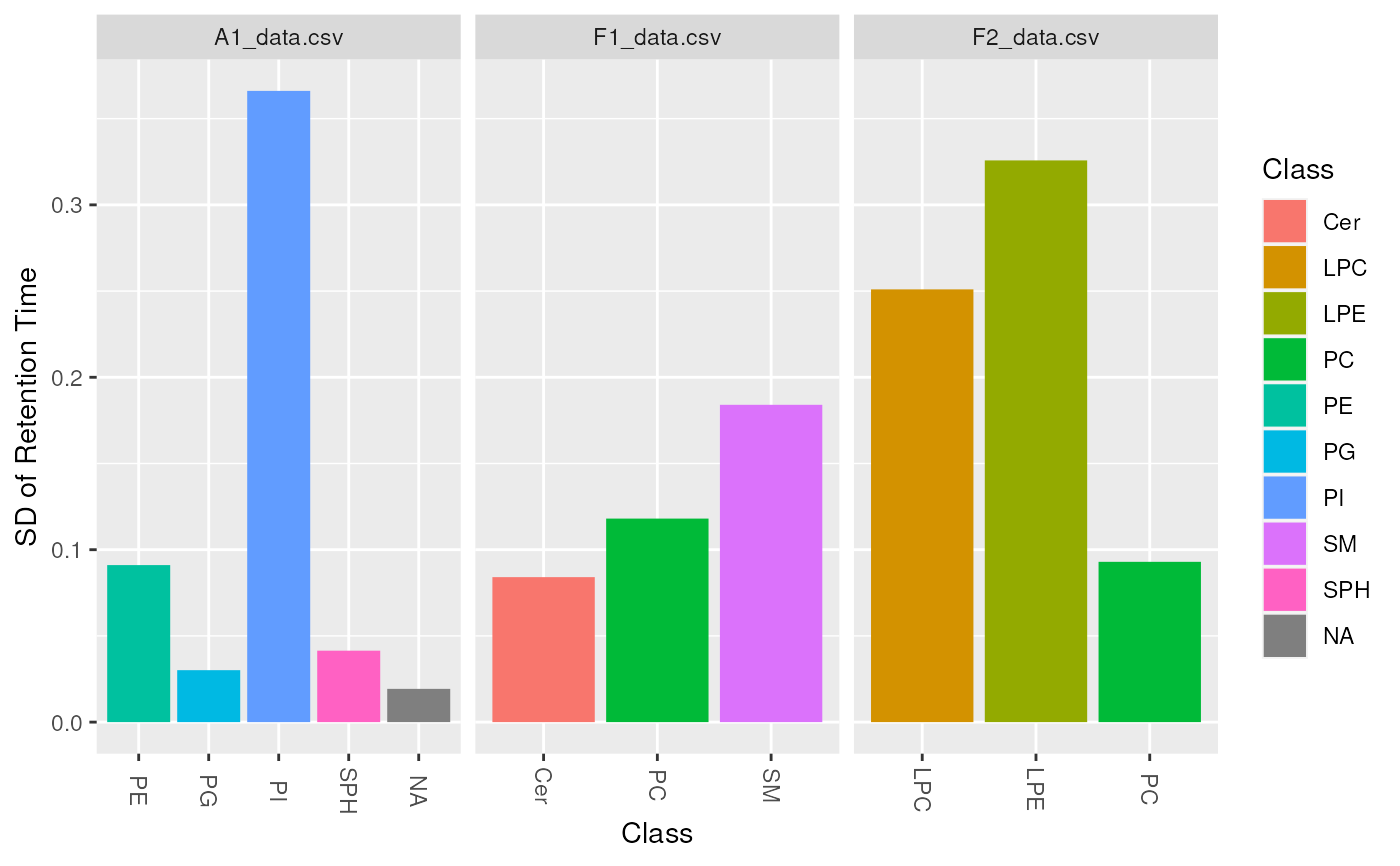
lipidr supports two types of plots for to visualize at lipid classes.sd plots a bar chart for standard deviation of a certain measure in each
class. This plot type is usually used to look at standard deviations of
intensity in each class, but can also be used to look at different measures
such as Retention Time, to ensure all lipids are eluted within the expected
range. To assess instrumental variation apply the function to technical
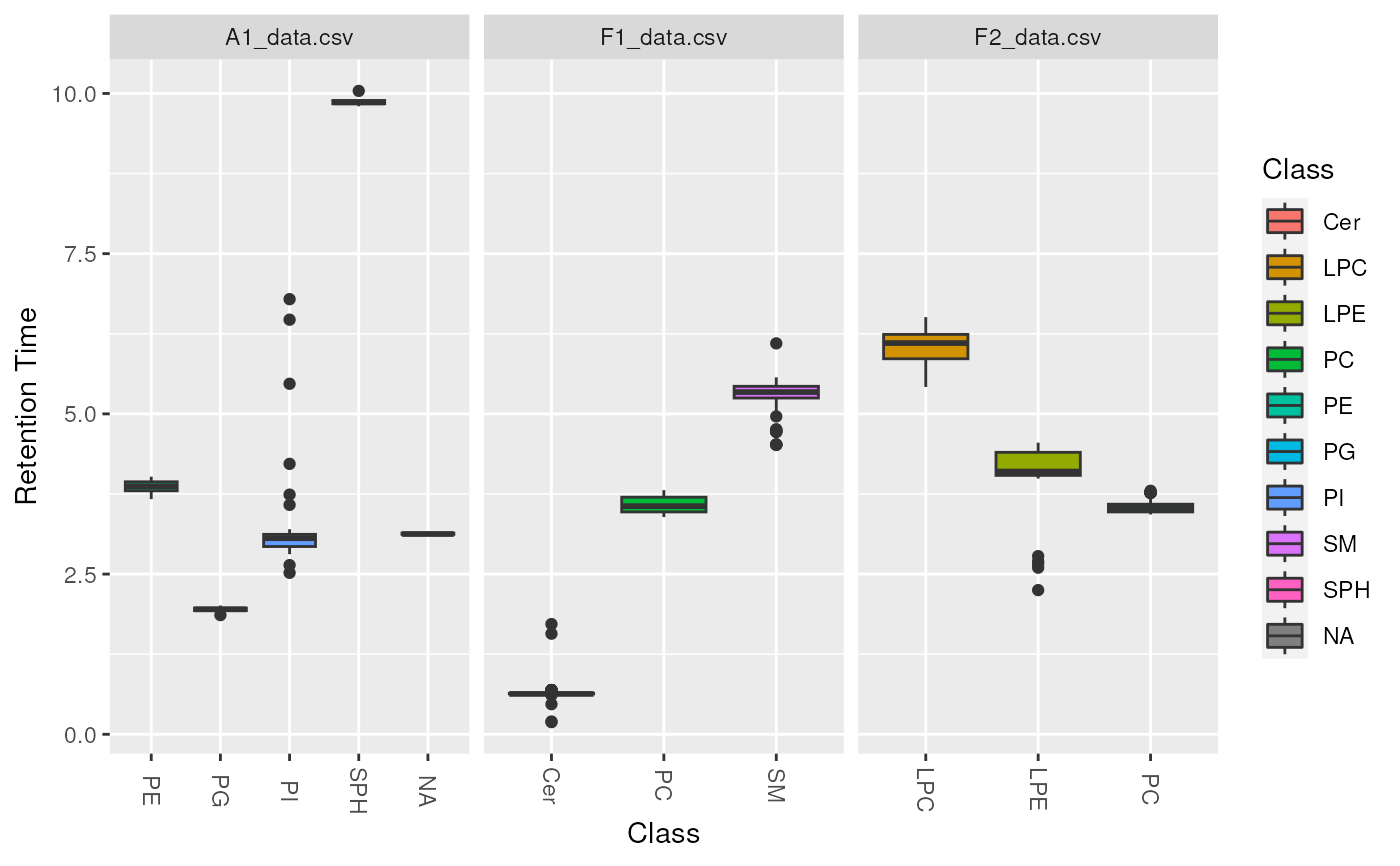
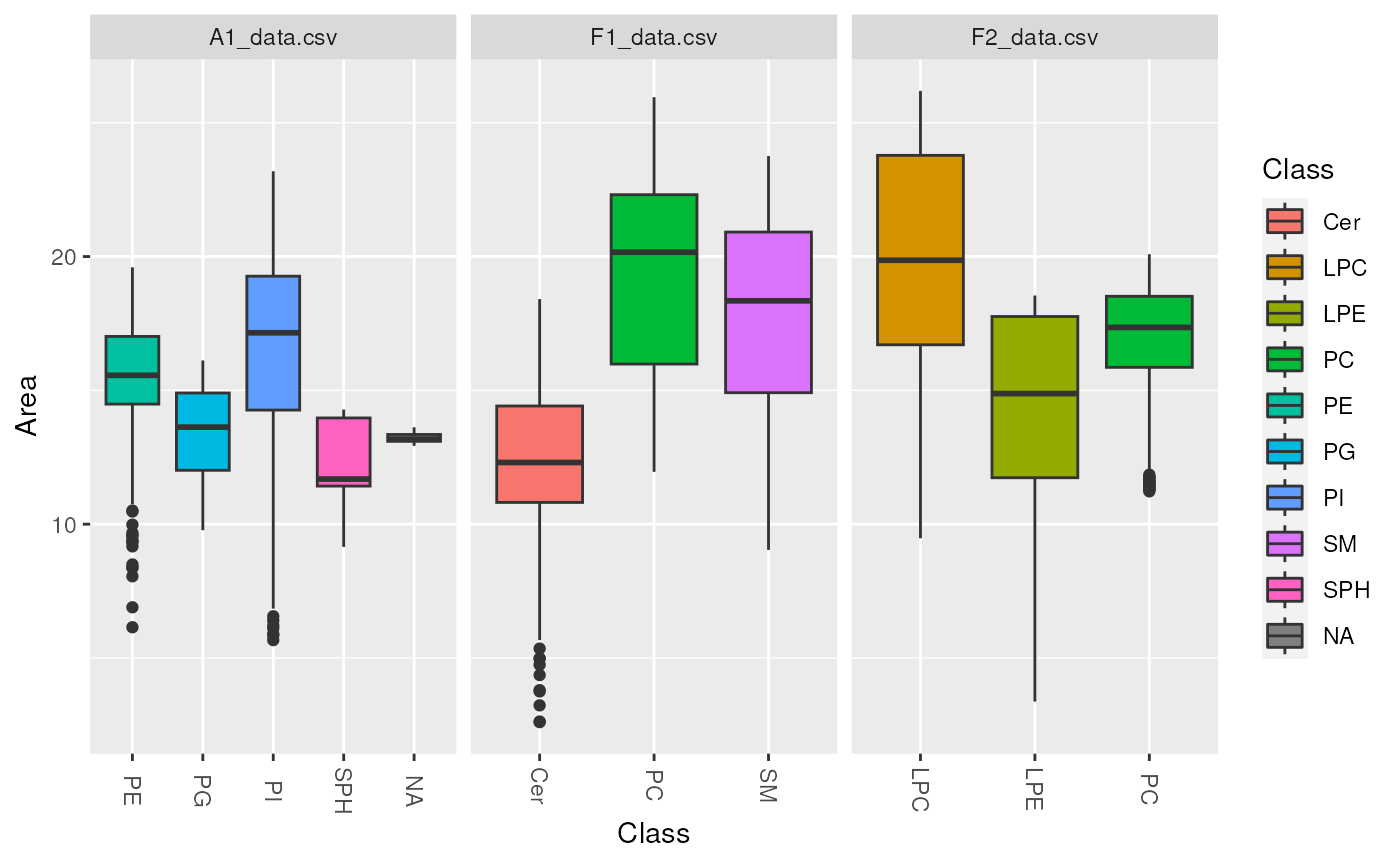
quality control samples. boxplot Plots a boxplot chart to examine the distribution of values per
class. This plot type is usually used to look at the intensity distribution
in each class, but can also be used to look at different measures, such as
Retention Time or Background.
plot_lipidclass(data, type = c("boxplot", "sd"), measure = "Area", log = TRUE)Arguments
- data
LipidomicsExperiment object.
- type
plot type, either
boxplotorsd. Default isboxplot.- measure
Which measure to plot the distribution of: usually Area, Area Normalized, Height or Retention Time. Default is
Area- log
Whether values should be log2 transformed. Default is
TRUE(Set FALSE for retention time).
Value
A ggplot object.
Examples
data(data_normalized)
d_qc <- data_normalized[, data_normalized$group == "QC"]
plot_lipidclass(d_qc, "sd", "Area", log = TRUE)
 plot_lipidclass(d_qc, "sd", "Retention Time", log = FALSE)
#> Warning: Removed 1 rows containing non-finite values (`stat_summary()`).
plot_lipidclass(d_qc, "sd", "Retention Time", log = FALSE)
#> Warning: Removed 1 rows containing non-finite values (`stat_summary()`).
 plot_lipidclass(d_qc, "boxplot", "Area", log = TRUE)
 plot_lipidclass(d_qc, "boxplot", "Retention Time", log = FALSE)
#> Warning: Removed 1 rows containing non-finite values (`stat_boxplot()`).
plot_lipidclass(d_qc, "boxplot", "Retention Time", log = FALSE)
#> Warning: Removed 1 rows containing non-finite values (`stat_boxplot()`).