lipidr supports three types of plots for to visualize at lipid molecules.
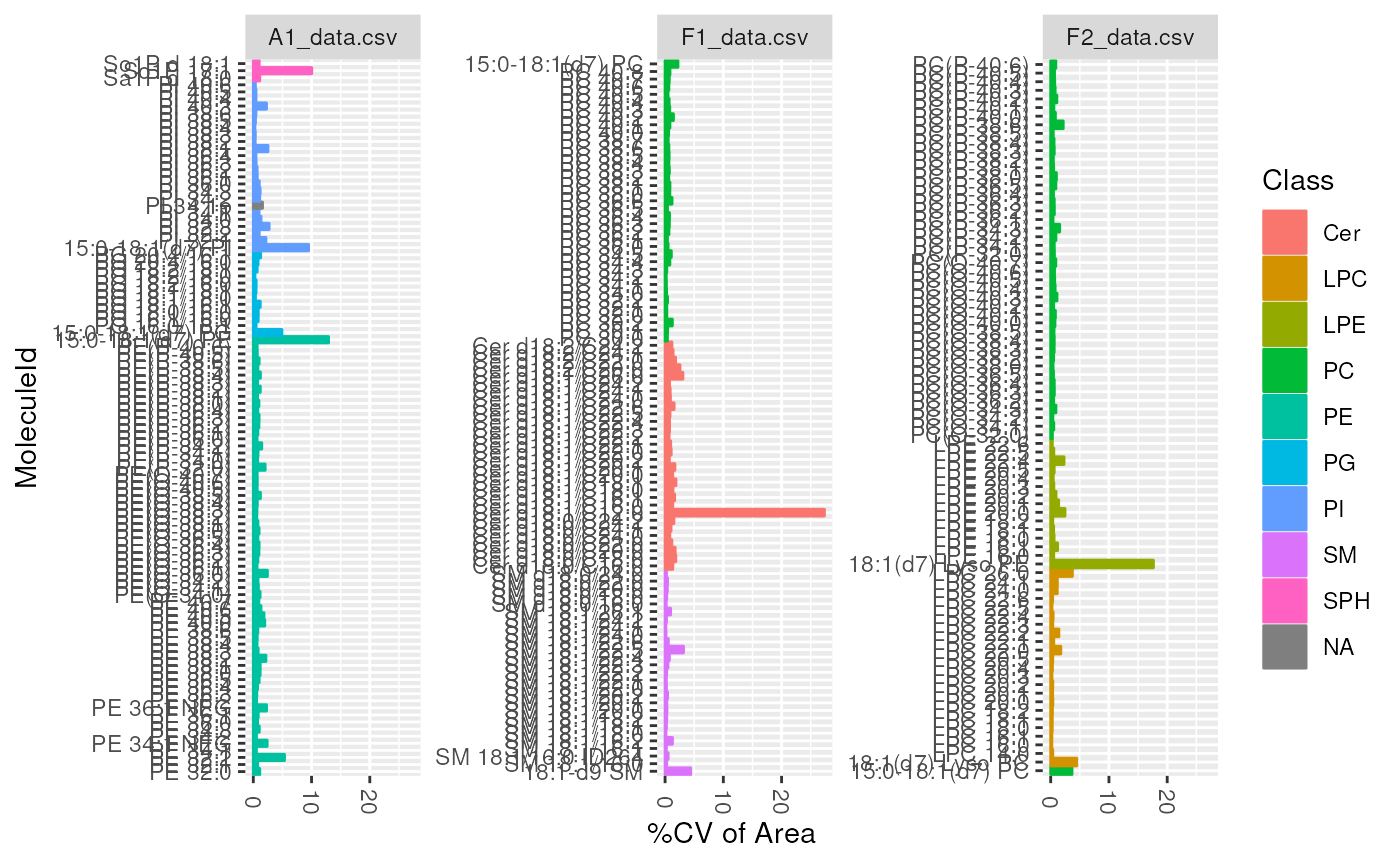
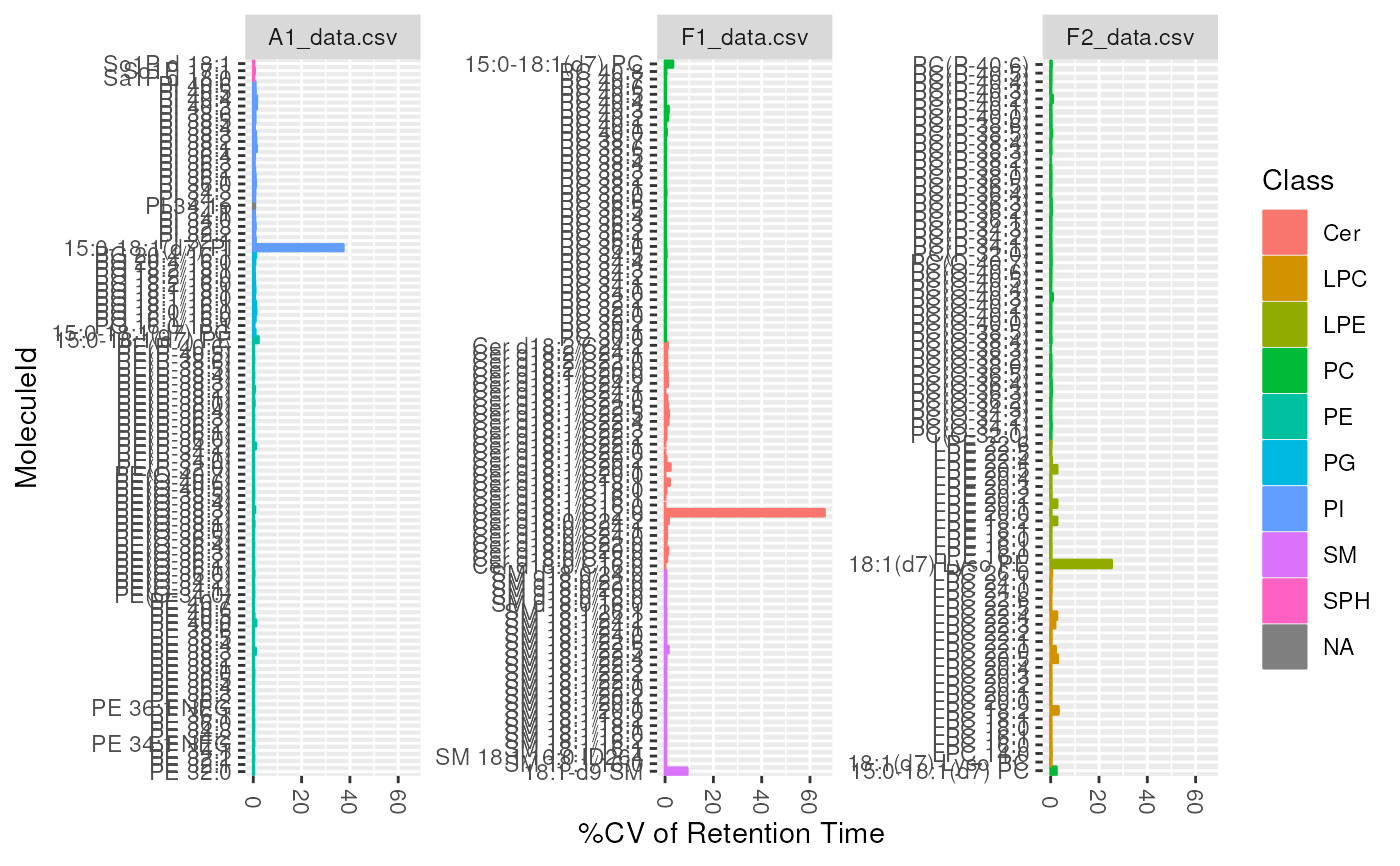
cv plots a bar chart for coefficient of variation of lipid molecules. This
plot type is usually used to investigate the CV in lipid intensity or
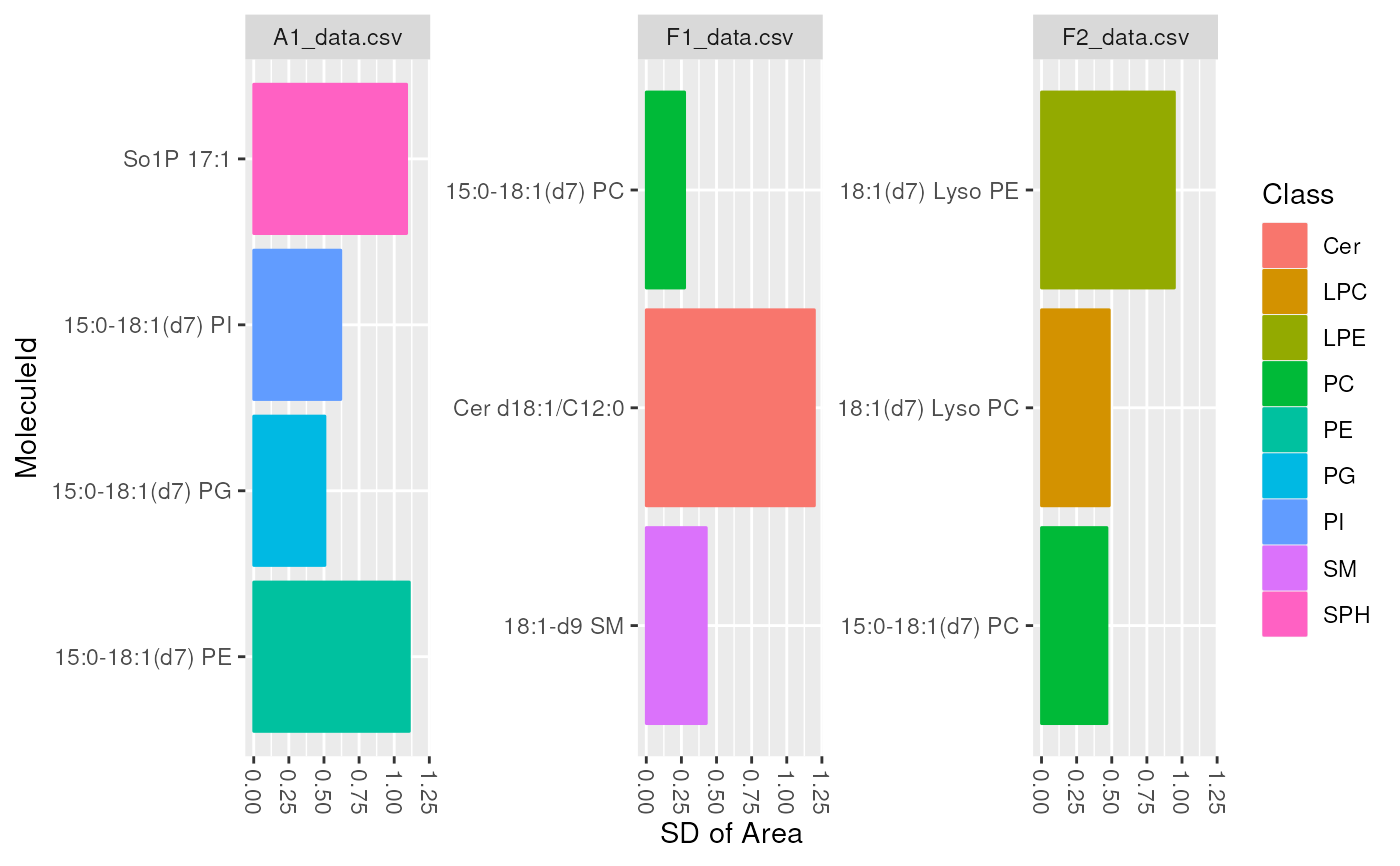
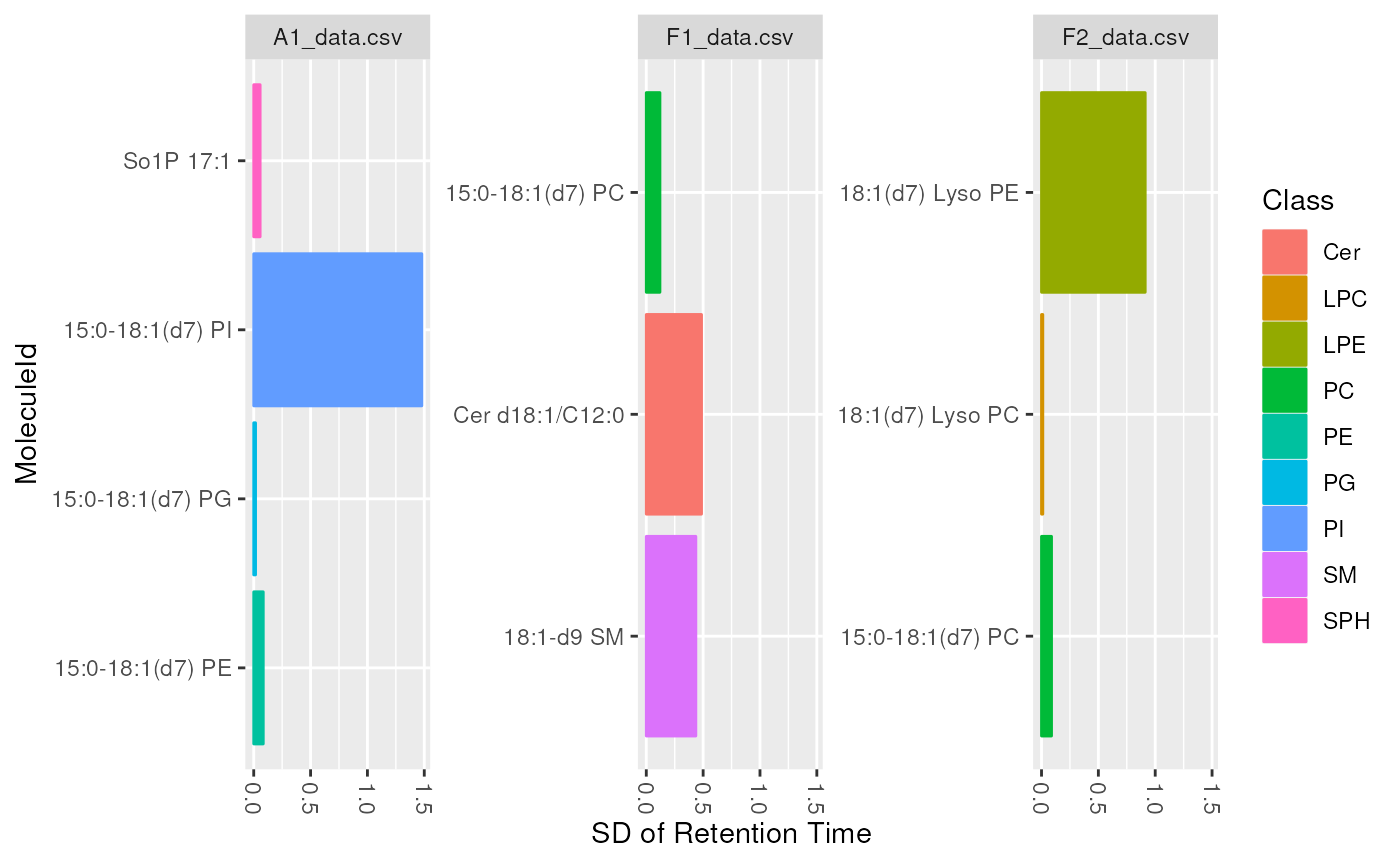
retention time, in QC samples. sd plots a bar chart for standard deviations of a certain measure in each
lipid. This plot type is usually used to look at standard deviation of
intensity for each lipid, but can also be used to look at different
measures such as Retention Time, to ensure all lipids elute within
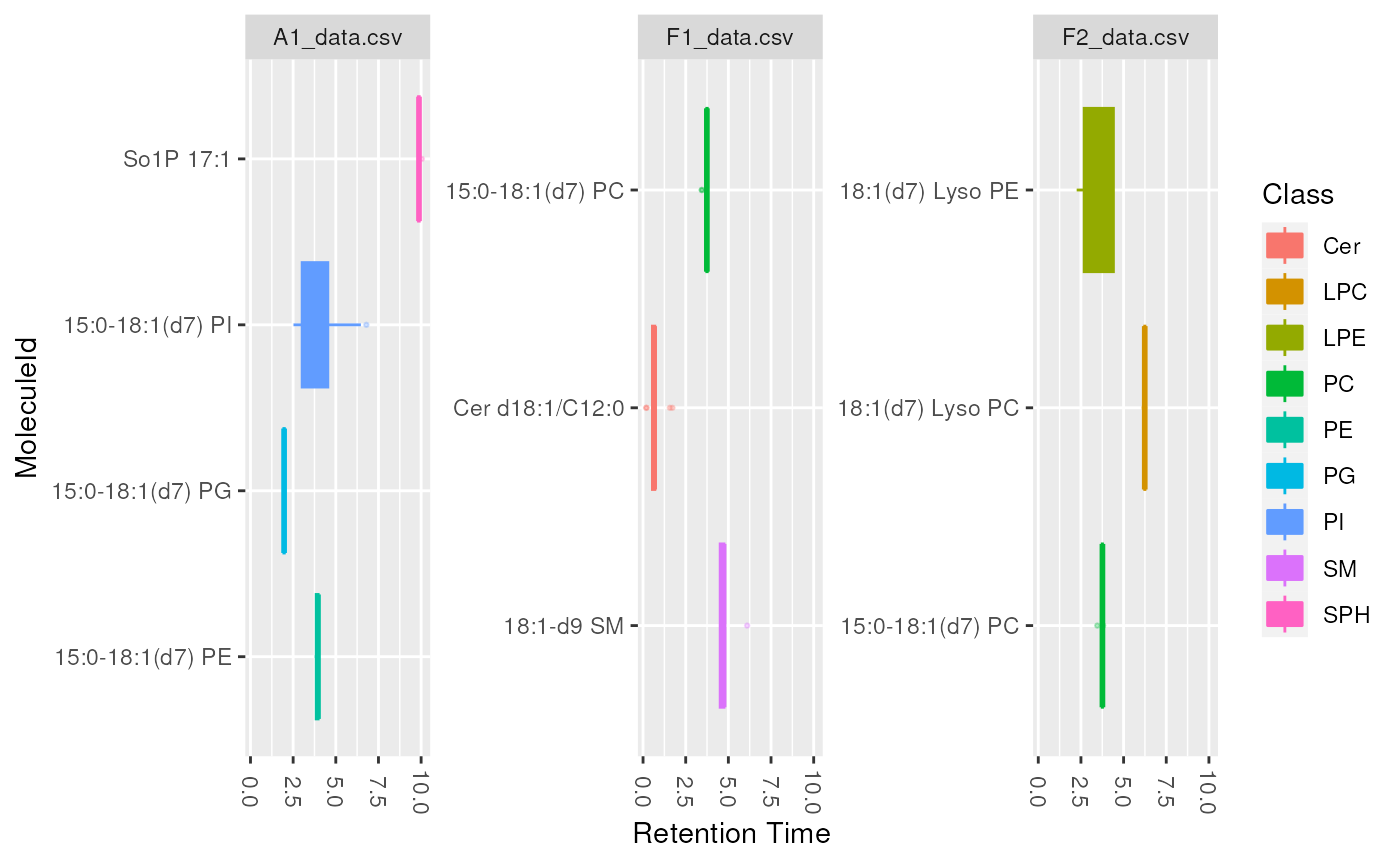
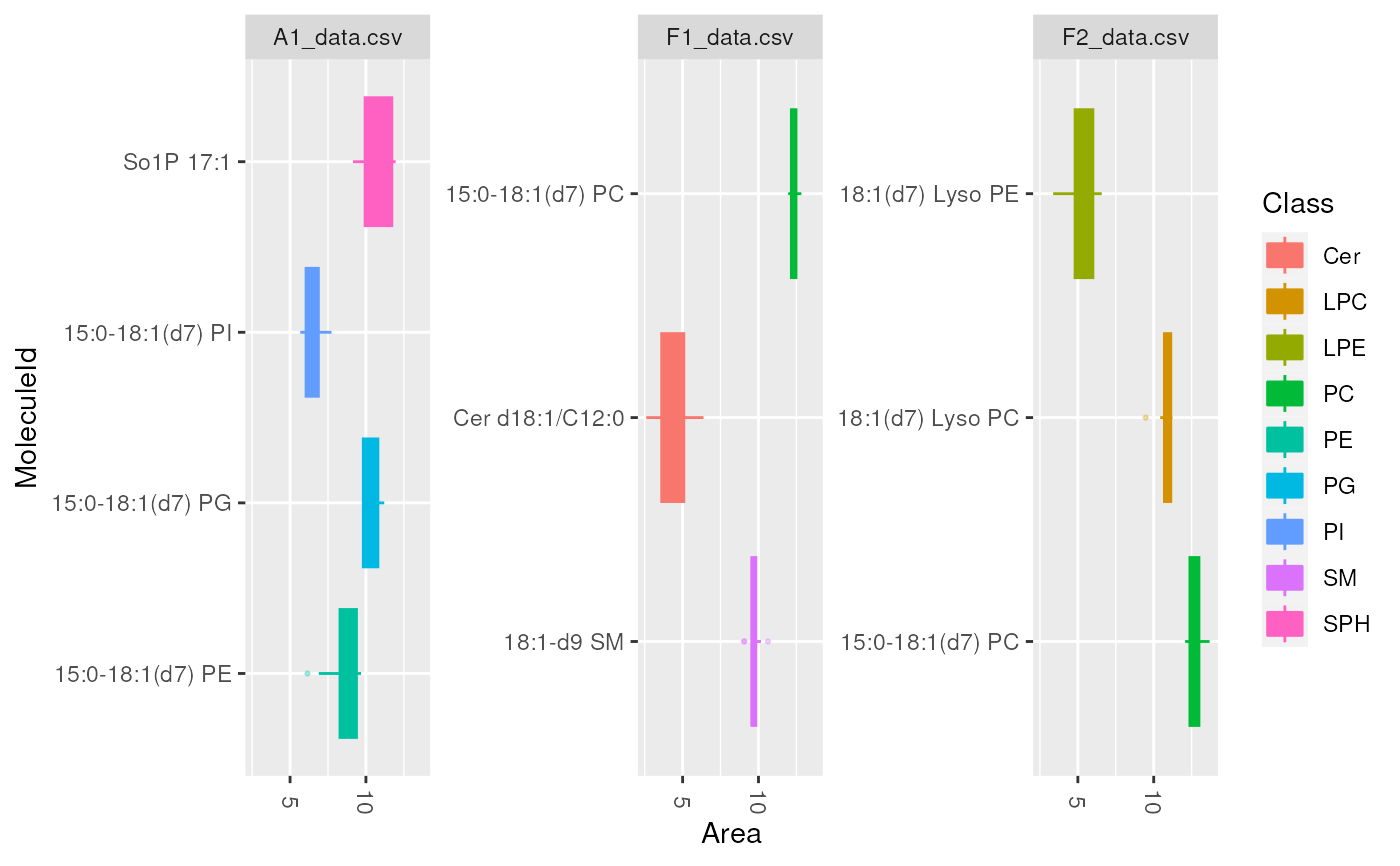
expected range. boxplot plots a boxplot chart to examine the distribution of values per
lipid. This plot type is usually used to look at intensity distribution
for each lipid, but can also be used to look at different measures, such as
Retention Time or Background.
plot_molecules(
  data,
  type = c("cv", "sd", "boxplot"),
  measure = "Area",
  log = TRUE,
  color = "Class"
)
Arguments
- data
LipidomicsExperiment object.
- type
plot type, either
cv,sdorboxplot. Default iscv.- measure
Which measure to plot the distribution of: usually Area, Area Normalized or Height. Default is
Area- log
Whether values should be log2 transformed (Set FALSE for retention time). Default is
TRUE- color
The column name of a row annotation to be used as color
Value
A ggplot object.
Examples
data(data_normalized)
d_qc <- data_normalized[, data_normalized$group == "QC"]
# plot the variation in intensity and retention time of all measured
# lipids in QC samples
plot_molecules(d_qc, "cv", "Area")
 plot_molecules(d_qc, "cv", "Retention Time", log = FALSE)
#> Warning: Removed 1 rows containing non-finite values (`stat_summary()`).
plot_molecules(d_qc, "cv", "Retention Time", log = FALSE)
#> Warning: Removed 1 rows containing non-finite values (`stat_summary()`).
 # plot the variation in intensity, RT of ISTD (internal standards)
# in QC samples
d_istd_qc <- data_normalized[
rowData(data_normalized)$istd,
data_normalized$group == "QC"
]
plot_molecules(d_istd_qc, "sd", "Area")
# plot the variation in intensity, RT of ISTD (internal standards)
# in QC samples
d_istd_qc <- data_normalized[
rowData(data_normalized)$istd,
data_normalized$group == "QC"
]
plot_molecules(d_istd_qc, "sd", "Area")
 plot_molecules(d_istd_qc, "sd", "Retention Time", log = FALSE)
#> Warning: Removed 1 rows containing non-finite values (`stat_summary()`).
plot_molecules(d_istd_qc, "sd", "Retention Time", log = FALSE)
#> Warning: Removed 1 rows containing non-finite values (`stat_summary()`).
 plot_molecules(d_istd_qc, "boxplot")
 plot_molecules(d_istd_qc, "boxplot", "Retention Time", log = FALSE)
#> Warning: Removed 1 rows containing non-finite values (`stat_boxplot()`).
plot_molecules(d_istd_qc, "boxplot", "Retention Time", log = FALSE)
#> Warning: Removed 1 rows containing non-finite values (`stat_boxplot()`).