Lipid set enrichment analysis (LSEA)
lsea(
  de.results,
  rank.by = c("logFC", "P.Value", "adj.P.Val"),
  min_size = 2,
  ...
)

significant_lipidsets(enrich.results, p.cutoff = 0.05, size.cutoff = 2)

plot_class_enrichment(de.results, significant.sets, measure = "logFC")

plot_enrichment(
  de.results,
  significant.sets,
  annotation = c("class", "length", "unsat"),
  measure = "logFC"
)
Arguments
- de.results
Output of
de_analysis().- rank.by
Statistic used to rank the lipid list. Default is
logFC.- min_size
Minimum number of molecules in a set to be included in enrichment.
- ...
Extra parameters passed to
fgsea::fgsea().- enrich.results
Output of
lsea().- p.cutoff
Significance threshold. Default is
0.05.- size.cutoff
Minimum number of lipids in a set tested for enrichment. Default is
2.- significant.sets
List of significantly changed lipid sets (output of
significant_lipidsets()).- measure
Which measure to plot the distribution of: logFC, P.Value, Adj.P.Val. Default is
logFC.- annotation
Which lipid set collection to plot.
Value
lsea returns enrichment results (data.frame) as returned from
fgsea::fgsea().
The results also contain the following attributes:
de.results Original de.results input.
rank.by Measure used to rank lipid molecules.
sets Lipid sets tested, with their member molecules.
significant_lipidsets returns a list of character vectors of
significantly enriched sets for each contrast.
plot_enrichment returns a ggplot object.
Functions
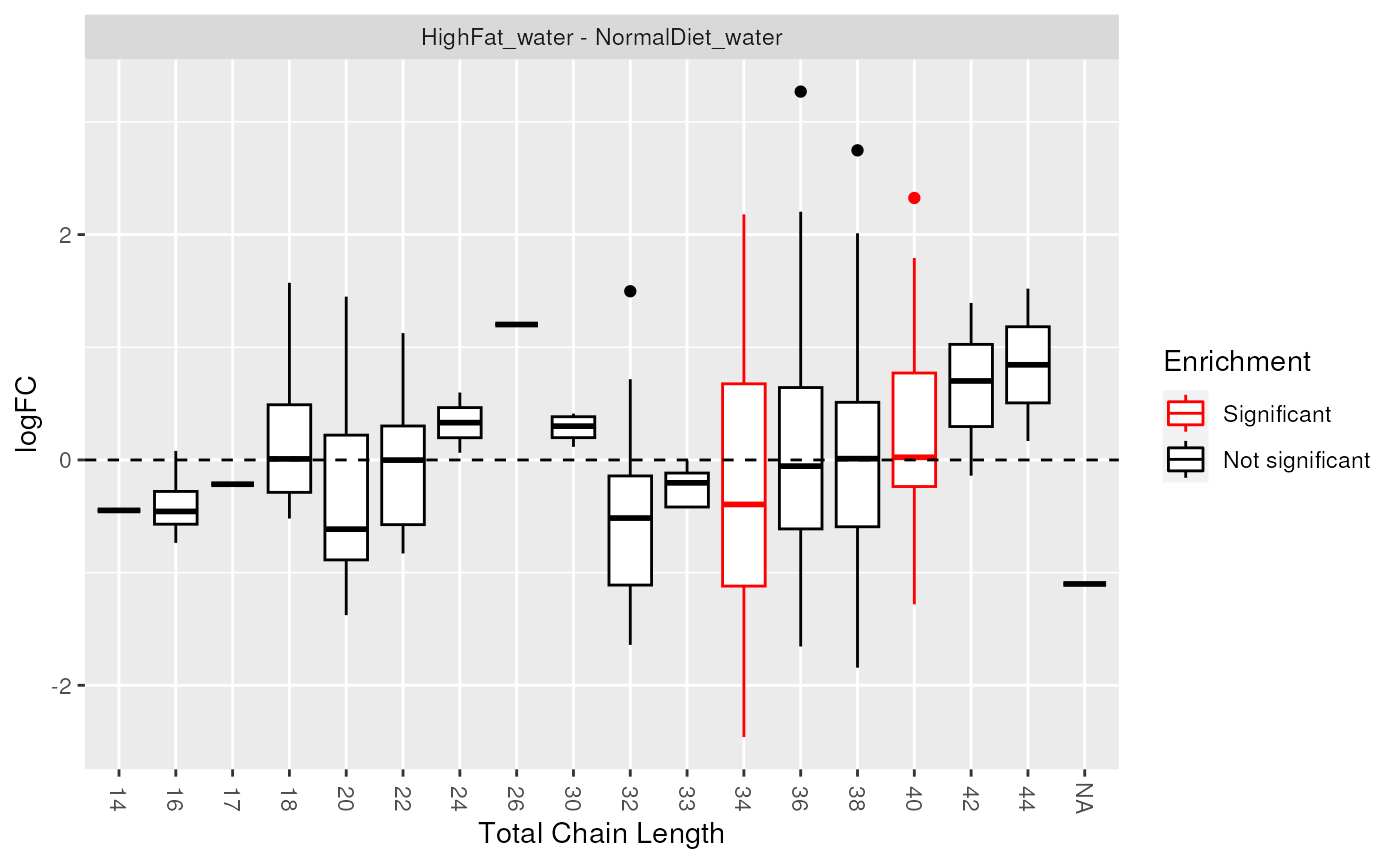
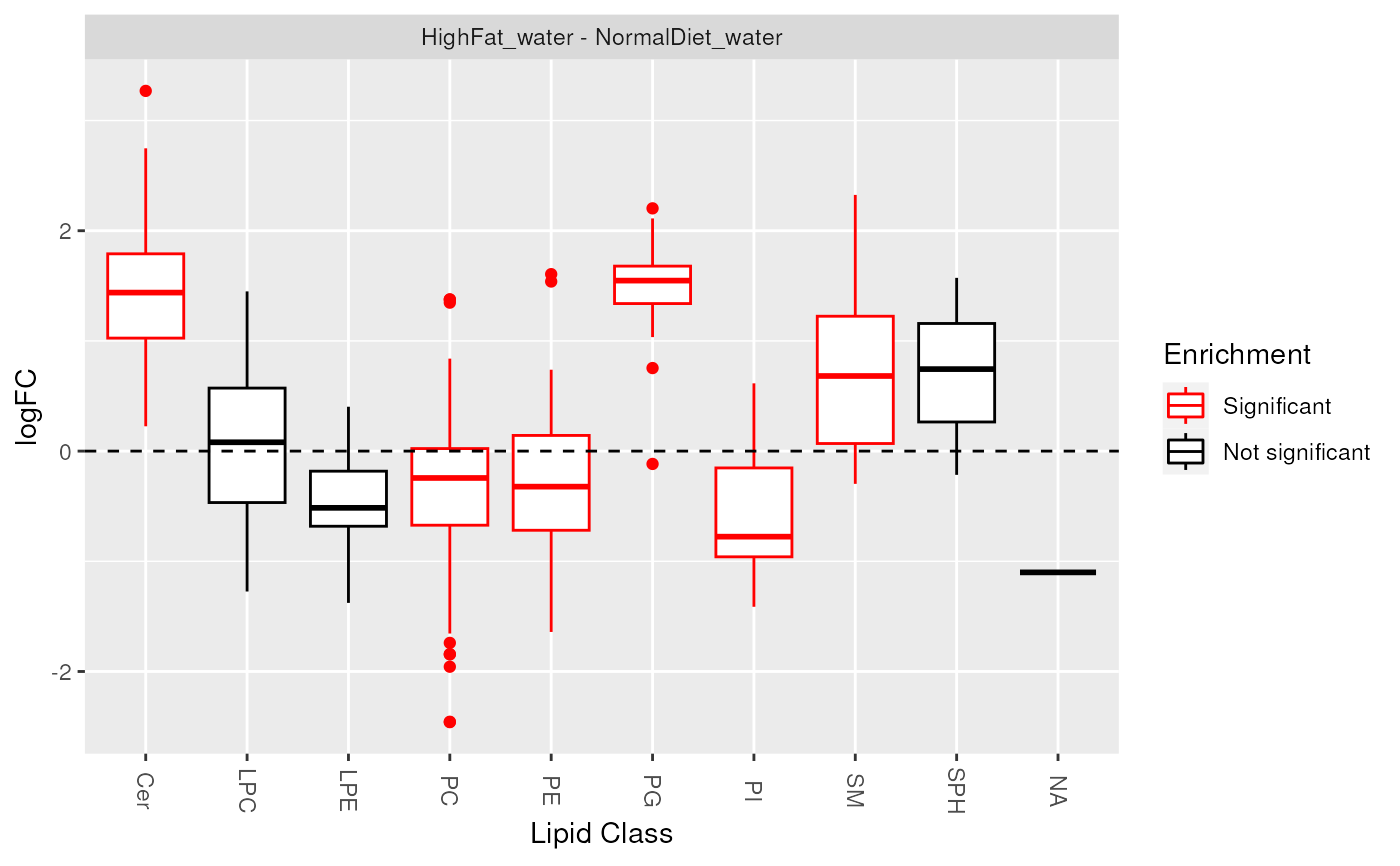
significant_lipidsets(): gets a list of significantly changed lipid setsplot_enrichment(): is usually used to look at log2 fold change distribution of lipids in each class, chain length or unsaturation, marking significantly enriched sets. It can also be used to plotP.ValueorAdj.P.Val.
Examples
data(data_normalized)
de_results <- de_analysis(
  data_normalized,
  HighFat_water - NormalDiet_water,
  measure = "Area"
)
enrich_results <- lsea(
  de_results,
  rank.by = "logFC", min_size = 4, nperm = 1000
)
#> Warning: There are ties in the preranked stats (5.78% of the list).
#> The order of those tied genes will be arbitrary, which may produce unexpected results.
sig_lipidsets <- significant_lipidsets(enrich_results)
plot_enrichment(de_results, sig_lipidsets, annotation="class")

plot_enrichment(de_results, sig_lipidsets, annotation="length")