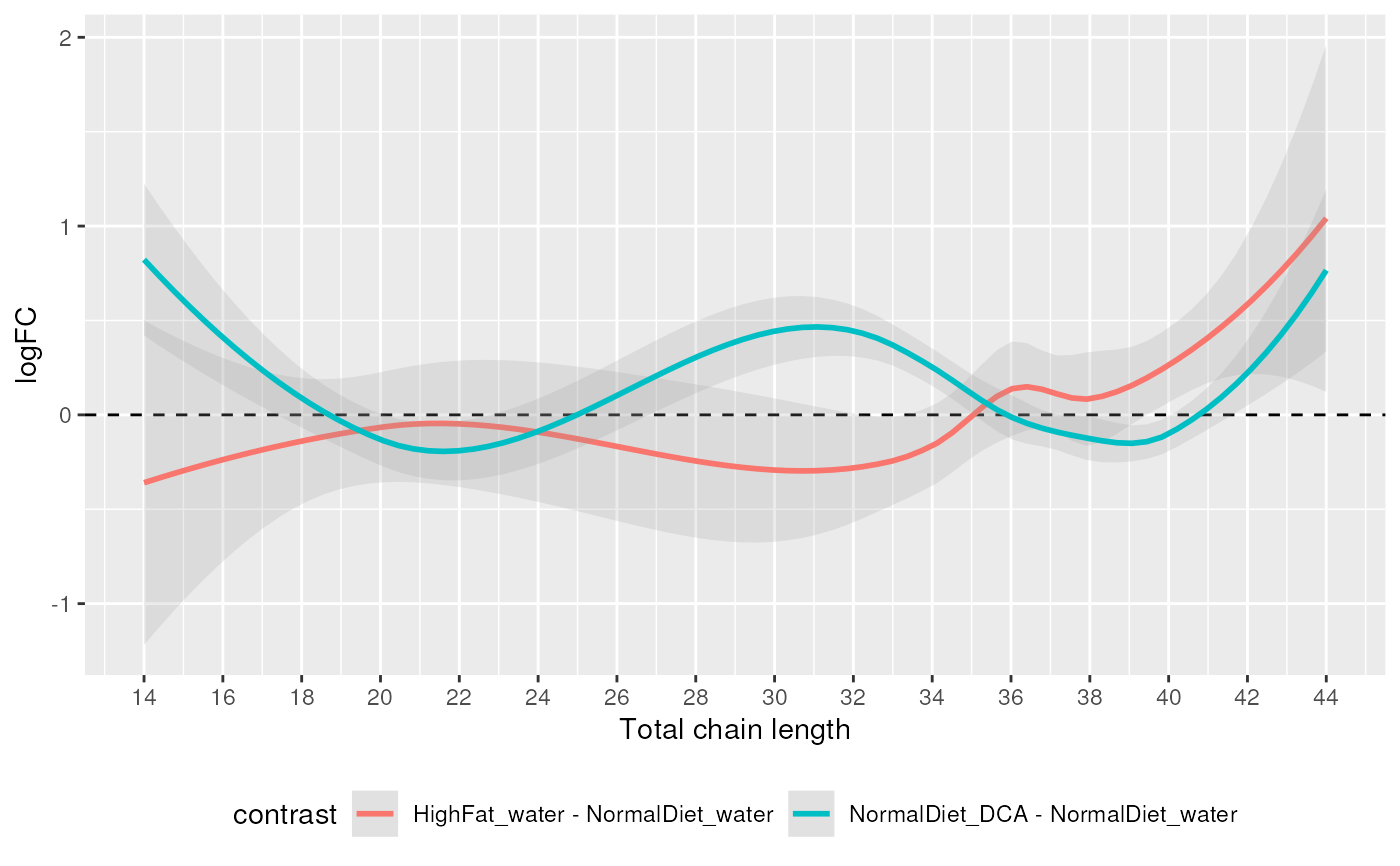
Fit and plot a regression line of (log2) fold changes and total chain lengths or unsaturations. If multiple comparisons are included, one regression is plotted for each.
plot_trend(de_results, annotation = c("length", "unsat"))Arguments
- de_results
Output of de_analysis.
- annotation
Whether to fit trend line against chain
lengthorunsat.
Value
A ggplot object.
Examples
data(data_normalized)
de_results <- de_analysis(
  data_normalized,
  HighFat_water - NormalDiet_water,
  NormalDiet_DCA - NormalDiet_water,
  measure = "Area"
)
plot_trend(de_results, "length")
#> `geom_smooth()` using method = 'loess' and formula = 'y ~ x'
#> Warning: Removed 2 rows containing non-finite values (`stat_smooth()`).